AnyChart JS Charts and Dashboards
This programme is presented to you by:
P.O. Box 34069 #381
98124-1069 Seattle
United States
| submit [at] anychart [dot] com | |
| Phone | +1 (206) 984-1843 |
| Facsimile | +1 (206) 984-1843 |
| Website | www.anychart.com |
| Category: | Web Development / Java & JavaScript |
| Version: | 8.7.0 |
| Release date: | 2019-08-07 |
| Size: | 17.81 |
| OS: | Win XP / Vista / 7 / 8 / 10 |
| Requirements: | None. JavaScript/HTML5 based; compatible with all platforms and browsers. |
| Languages: | German, English |
| Downloads: | 0 in January / 23 in total |
Rating: 1.67/10 (3 votes cast)
| Download: | cdn.anychart.com/releases/8.7.0/anychart-installation-package-8.7.0.zip |
| Infopage: | www.anychart.com/products/anychart/overview |
AnyChart is a robust and superfast JavaScript charting library to add great-looking, interactive HTML5 charts into any project, in any browser, and on any platform/OS including mobile ones.
AnyChart provides advanced customization and flexibility opportunities, no matter if you are developing a website, a business intelligence application (BI) for corporate usage, or some software for your clients. Our JavaScript API makes it possible for you to create even big data based charts in real time, with continuous updates and multi-level drill-downs. Moreover, whatever server platform or database you use in your project, AnyChart is ready to fulfill your dream to surprise your customers with amazing informative JS charts and dashboards regardless of device - on Macs, laptops, PCs, smartphones, and tablets.
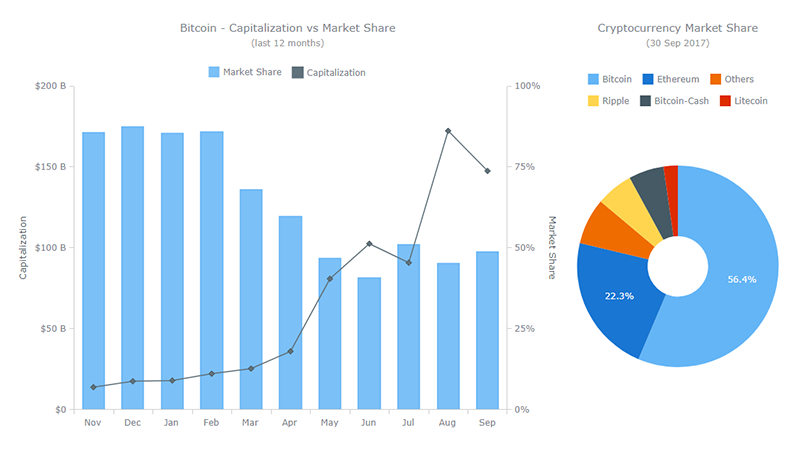
AnyChart provides scatter, line, bar, area, waterfall, spline, funnel, bubble, polar, column, column range, pie, box plot, linear and angular gauges, area spline range, Mekko, Venn, Sankey Diagram, waterfall, quadrant, tag cloud, and lots of other sorts of charts available separately and in combination, 2D and 3D.
In a nutshell, AnyChart HTML5 chart library's advantages boil down to the following out-of-the-box features:
* 60+ chart types;
* chart design themes and color palettes;
* chart export to PDF, PNG, JPG, SVG, PS, chart data export to CSV and XLSX (Excel), social network sharing;
* many web app samples with interactive BI dashboards;
* localization engine (194 predefined locale files),
as well as advanced interactivity (tooltips on hover, drill-down, exclude data point, multi-selection, and more), multiple axes, async rendering, online chart editor, and much more to easily create beautiful interactive JS data visualization for any web projects.
Show / Hide
Here you can subscribe for the update infos for this programme. You will then receive an e-mail notice each time an update has been submitted for this programme.
In order to subscribe for the update infos, please enter your e-mail address below. You will then receive an e-mail with a link, which you need to click in order to confirm you subscription.
You can unsubscribe from the list at any time. For this purpose, you will find a link at the end of each update info e-mail.
This service is completely free of charge for you.
