AnyGantt JS Gantt Charts
This programme is presented to you by:
P.O. Box 34069 #381
98124-1069 Seattle
United States
| submit [at] anychart [dot] com | |
| Phone | +1 (206) 984-1843 |
| Facsimile | +1 (206) 984-1843 |
| Website | www.anychart.com |
| Category: | Web Development / Java & JavaScript |
| Version: | 8.7.0 |
| Release date: | 2019-08-08 |
| Size: | 17.81 |
| OS: | Win XP / Vista / 7 / 8 / 10 |
| Requirements: | None. JavaScript/HTML5 based; compatible with all devices, platforms and browsers. |
| Languages: | German, English |
| Downloads: | 0 in July / 23 in total |
Rating: 2.00/10 (4 votes cast)
| Download: | cdn.anychart.com/releases/8.7.0/anychart-installation-package-8.7.0.zip |
| Infopage: | www.anychart.com/products/anygantt/overview |
AnyGantt JS Gantt Charts library is an advanced JavaScript-based data visualization solution, allowing everyone to utilize power of animation and ultimate interactivity. AnyGantt is perfect for building complex and informative HTML5 Gantt charts.
AnyGantt is fully cross-browser and cross-platform. It can be used with ASP.NET, ASP, PHP, JSP, ColdFusion, Ruby on Rails or simple HTML pages. With AnyGantt you can visualize data from any warehouse: from files in text, Excel, CSV formats to MySQL, MS SQL, and Oracle database servers.
You can use server or desktop platform of your choice to create your application - AnyGantt will take care of charting. Right visualization helps you to turn your data into Right Decisions! If you need advanced, award-winning Gantt diagrams, then AnyGantt is the perfect solution for you.
Features:
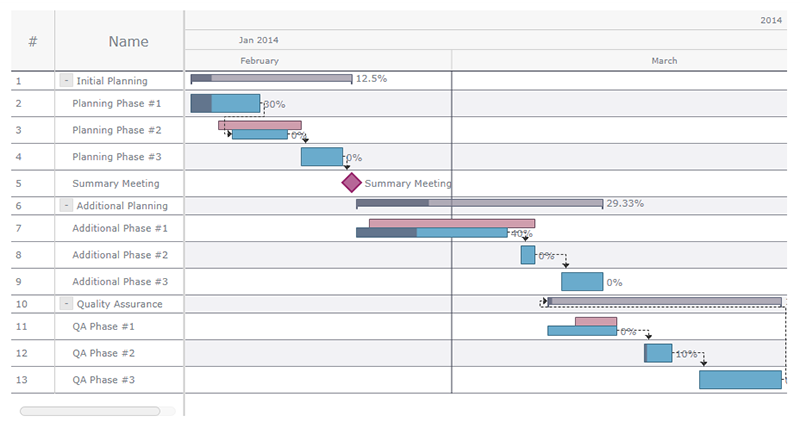
* AnyGantt supports Project (Task-based) and Schedule (Resource-based) Gantt charts for project planning, and PERT (Program Evaluation & Review Technique) charts for decision making - all with configurable Timeline, DataGrid, and other features.
* Style Based Visualization allows developers to focus on the business logic. Nicely designed defaults allow keeping design tasks away at all!
* For all text-based elements, such as labels, tooltips or data-grid columns AnyGantt features powerful formatting options.
* Data Grid that holds basic task or resource information is highly configurable. You can add any number of custom columns that can contain additional task or resource data. Each column can have custom text formatting, height and text style settings. Data grid itself can be redesigned to reflect important data specifics.
* Each element of AnyChart Gantt charts can be configured in its own way with a help of the flexible design system.
* AnyGantt is a JavaScript-based component, which can be used in any Web project. It doesn't depend on any server-side platform, all you need is JavaScript enabled browser on client-side.
Show / Hide
Here you can subscribe for the update infos for this programme. You will then receive an e-mail notice each time an update has been submitted for this programme.
In order to subscribe for the update infos, please enter your e-mail address below. You will then receive an e-mail with a link, which you need to click in order to confirm you subscription.
You can unsubscribe from the list at any time. For this purpose, you will find a link at the end of each update info e-mail.
This service is completely free of charge for you.