AnyMap JS Maps
This programme is presented to you by:
P.O. Box 34069 #381
98124-1069 Seattle
United States
| submit [at] anychart [dot] com | |
| Phone | +1 (206) 984-1843 |
| Facsimile | +1 (206) 984-1843 |
| Website | www.anychart.com |
| Category: | Web Development / Java & JavaScript |
| Version: | 8.7.0 |
| Release date: | 2019-08-08 |
| Size: | 17.81 |
| OS: | Win XP / Vista / 7 / 8 / 10 |
| Requirements: | None. JavaScript/HTML5 based; compatible with all devices, platforms and browsers. |
| Languages: | German, English |
| Downloads: | 0 in July / 15 in total |
Rating: 4.67/10 (3 votes cast)
| Download: | cdn.anychart.com/releases/8.7.0/anychart-installation-package-8.7.0.zip |
| Infopage: | www.anychart.com/products/anymap/overview |
AnyMap JS Maps is an advanced JavaScript/HTML5 mapping library which makes you able to easily create interactive maps that look great on any device including PCs, Macs, iPhones, iPads, Android devices and others - on any platform and in any browser.
AnyMap JS is perfect for interactive dashboards and side-by-side reporting. You can use it to display sales by region, election results, weather forecast, population density, and any other geo-related data.
AnyMap JS comes with our ready-to-use Map Collection which you can use at no additional cost. Maps are supplied in GeoJSON, which makes them flexible in working and editing. Custom maps can be created from any SHP map.
AnyMap JS maps are fully compatible with other AnyChart JS Charts' HTML5 charting solutions - AnyChart JS (basic JavaScript charts), AnyStock JS (date/time JavaScript/HTML5 charts, e.g. financial and stock charts that visualize real-time data), and AnyGantt JS (JavaScript/HTML5 Gantt charts), and can be used both in a dashboard and as a standalone map visualization solution.
Features of AnyMap JS:
* Ever-expanding Map Collection with various country-specific and world maps.
* Highly customizable. Special reaction to certain events can be assigned with the help of event listeners.
* Wide variety of interactive options for your HTML5 maps, including tooltips, selection, hover, drill-down, etc.
* Support for various types of maps including Choropleth Map, Point (Dot) Map, Bubble Map, Connector Map, and Seat Map for displaying data related to geographic areas in HTML5 based web projects.
* Longitude/latitude support allows you to set coordinates (location) of Bubbles in Bubble JavaScript Charts in long/lat degrees. The API allows you to convert mouse coordinates to longitude and latitude (transform), and vice versa.
* Changing scale, moving map, and creating custom UI (buttons, scrolls, etc.) via API.
* Rich integration of keyboard and mouse controls.
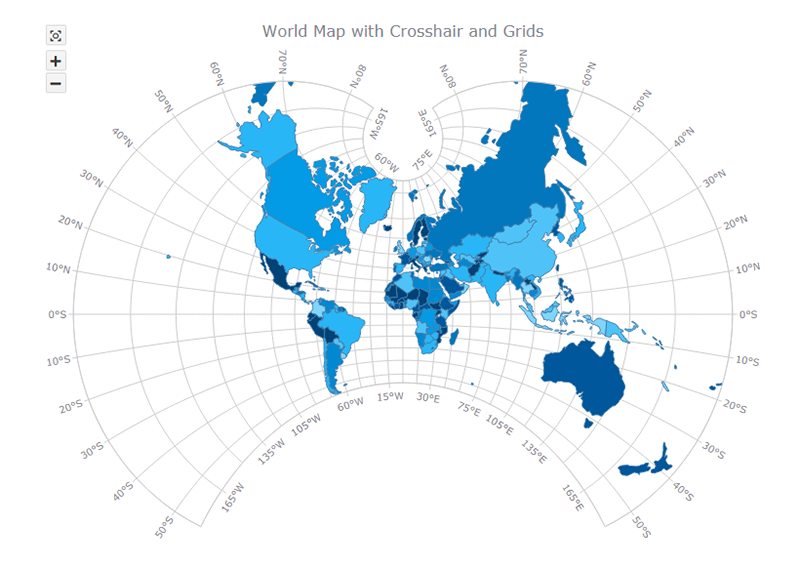
* Map projections.
Show / Hide
Here you can subscribe for the update infos for this programme. You will then receive an e-mail notice each time an update has been submitted for this programme.
In order to subscribe for the update infos, please enter your e-mail address below. You will then receive an e-mail with a link, which you need to click in order to confirm you subscription.
You can unsubscribe from the list at any time. For this purpose, you will find a link at the end of each update info e-mail.
This service is completely free of charge for you.