AnyStock Stock and Financial JS Charts
This programme is presented to you by:
P.O. Box 34069 #381
98124-1069 Seattle
United States
| submit [at] anychart [dot] com | |
| Phone | +1 (206) 984-1843 |
| Facsimile | +1 (206) 984-1843 |
| Website | www.anychart.com |
| Category: | Web Development / Java & JavaScript |
| Version: | 8.7.0 |
| Release date: | 2019-08-08 |
| Size: | 17.81 |
| OS: | Win XP / Vista / 7 / 8 / 10 |
| Requirements: | None. JavaScript/HTML5 based; compatible with all devices, platforms and browsers. |
| Languages: | German, English |
| Downloads: | 0 in July / 13 in total |
Rating: 2.50/10 (2 votes cast)
| Download: | cdn.anychart.com/releases/8.7.0/anychart-installation-package-8.7.0.zip |
| Infopage: | www.anychart.com/products/anystock/overview |
AnyChart Stock and Financial JS Charts (short: AnyStock) is a JavaScript based financial and stock charting library, also used for visualizing any timeline data over a long time. AnyStock technology turns your real-time data into highly sophisticated charts with interactive features, bringing visualization of your data to the Web and providing a full feature set for creating real-time streaming and data manipulation applications.
Designed to display date and time based information, AnyStock is the ideal tool for client reporting and performance reporting applications. Reports and Dashboards are visualized with scrolling, drill downs, panning and zoom functionality available in all of our HTML5 charts. AnyStock brings analysis of your FOREX, commodity and investment market data to life. The ability to review long term and large data sets can easily be handled with scroll, pan, and zoom controls.
AnyStock is fully integrated into AnyChart 7 Framework and shares most of its ideology, settings technique and ease of use - and you can use AnyStock along other charts including those available in the AnyChart JavaScript Charts, AnyGantt JavaScript Gantt Charts, and AnyMap JavaScript Maps.
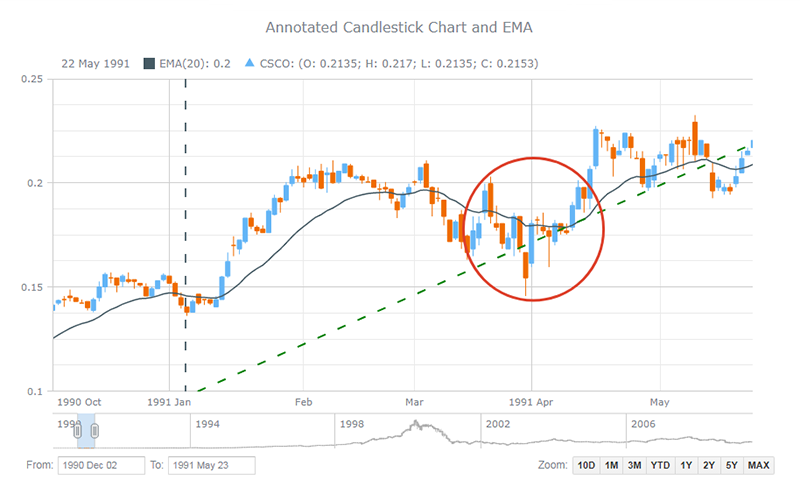
AnyStock supports a wide range of stock chart types (including Candlestick, OHLC, Line, Spline, Column, Step Line, Area, Step Area, Spline Area, Marker, Range Column, Range Area, Range Spline Area, Stacked Stock JS charts) and technical analysis indicators (MACD, ROC, RSI, SMA, EMA, DMI, CHO, CCI, and others; customs indicators can be set up). Drawing tools (including Line segment, Ray, Trend line, Trend channel, Andrew's pitchfork, Fibonacci fan, Buy/Sell signals, and many others) and adding of news events (analyst opinions, insider trading, dividends, and key developments) to improve the ability to analyze information effectively are also available and have made an important contribution to the superfast HTML5 visualization of stock/financial or any timeline data w/ AnyStock JS.
Show / Hide
Here you can subscribe for the update infos for this programme. You will then receive an e-mail notice each time an update has been submitted for this programme.
In order to subscribe for the update infos, please enter your e-mail address below. You will then receive an e-mail with a link, which you need to click in order to confirm you subscription.
You can unsubscribe from the list at any time. For this purpose, you will find a link at the end of each update info e-mail.
This service is completely free of charge for you.