AnyStock Stock and Financial JS Charts
Dieses Programm wird Ihnen präsentiert von:
P.O. Box 34069 #381
98124-1069 Seattle
United States
| submit [at] anychart [dot] com | |
| Telefon | +1 (206) 984-1843 |
| Telefax | +1 (206) 984-1843 |
| Website | www.anychart.com |
| Kategorie: | Web Entwicklung / Java & JavaScript |
| Version: | 8.7.0 |
| Release-Datum: | 08.08.2019 |
| Größe: | 17,81 |
| Betriebssystem: | Win XP / Vista / 7 / 8 / 10 |
| Anforderungen: | None. JavaScript/HTML5 based; compatible with all devices, platforms and browsers. |
| Sprachen: | Deutsch, Englisch |
| Downloads: | 0 im Juli / 13 insgesamt |
Bewertung: 2,50/10 (2 Stimmen abgegeben)
| Download: | cdn.anychart.com/releases/8.7.0/anychart-installation-package-8.7.0.zip |
| Infoseite: | www.anychart.com/products/anystock/overview |
AnyChart Stock and Financial JS Charts (short: AnyStock) is a JavaScript based financial and stock charting library, also used for visualizing any timeline data over a long time. AnyStock technology turns your real-time data into highly sophisticated charts with interactive features, bringing visualization of your data to the Web and providing a full feature set for creating real-time streaming and data manipulation applications.
Designed to display date and time based information, AnyStock is the ideal tool for client reporting and performance reporting applications. Reports and Dashboards are visualized with scrolling, drill downs, panning and zoom functionality available in all of our HTML5 charts. AnyStock brings analysis of your FOREX, commodity and investment market data to life. The ability to review long term and large data sets can easily be handled with scroll, pan, and zoom controls.
AnyStock is fully integrated into AnyChart 7 Framework and shares most of its ideology, settings technique and ease of use - and you can use AnyStock along other charts including those available in the AnyChart JavaScript Charts, AnyGantt JavaScript Gantt Charts, and AnyMap JavaScript Maps.
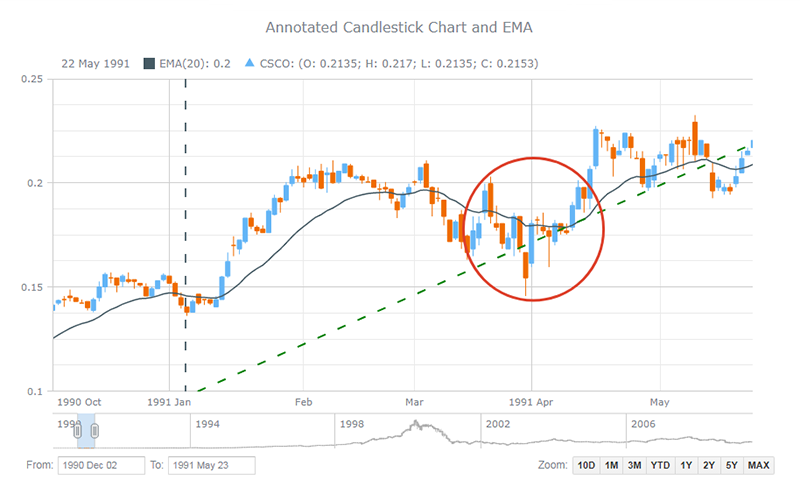
AnyStock supports a wide range of stock chart types (including Candlestick, OHLC, Line, Spline, Column, Step Line, Area, Step Area, Spline Area, Marker, Range Column, Range Area, Range Spline Area, Stacked Stock JS charts) and technical analysis indicators (MACD, ROC, RSI, SMA, EMA, DMI, CHO, CCI, and others; customs indicators can be set up). Drawing tools (including Line segment, Ray, Trend line, Trend channel, Andrew's pitchfork, Fibonacci fan, Buy/Sell signals, and many others) and adding of news events (analyst opinions, insider trading, dividends, and key developments) to improve the ability to analyze information effectively are also available and have made an important contribution to the superfast HTML5 visualization of stock/financial or any timeline data w/ AnyStock JS.
Einblenden / Ausblenden
Hier können Sie die Update-Infos für dieses Programm abonnieren. Sie erhalten dann zukünftig eine Benachrichtigung per Email, sobald ein Update zu diesem Programm eingetragen wurde.
Um die Update-Infos zu abonnieren, tragen Sie nachfolgend Ihre E-Mail-Adresse ein. Sie erhalten dann eine E-Mail mit einem Link, über den Sie das Abo bestätigen müssen.
Sie können die Update-Infos jederzeit wieder abbestellen. Hierzu finden Sie am Ende jeder E-Mail mit Update-Infos einen entsprechenden Link.
Dieser Service ist für Sie vollkommen kostenlos.
Kommentare zu AnyStock Stock and Financial JS Charts
Einblenden / Ausblenden
Bisher gibt es keine Kommentare zu diesem Programm.
Selbst einen Kommentar schreiben